1. Introduction
Type-token ratios (TTRs) are commonly used for assessing child language development. They are also occasionally used in other studies, for example to compare subcorpora or varieties of English more generally. A related concept is a hapax-token ratio (HTR), which we also discuss below.
TTRs can be expressed as a simple proportion, p = f / n, where f is the number of types and n the number of tokens in a text.
Definitions vary according to what constitutes a ‘type’, and what a ‘token’, but the key principles are that tokens are capable of being categorised into types, and types constitute an open set, such as words, nouns or verbs.
For example, we might define a TTR for lexical words, where ‘types’ are classed as identical spellings of a word undifferentiated by word class. Consider this excerpt from a spoken transcription of a conversation text in the British Component of the International Corpus of English, ICE-GB.
(1)OK Adam uhm <,> what did you see as missing from other <,> activities for the disabled which might have <,> got you into starting this group <,,>
I think the main things that I saw as <,> as absent from disa from work with with disabled people was
Sorry could you start again [S1A-001 #1-3]
This obtains a TTR of 38/45, excluding self-correction and pauses.
| words | tokens | types | TTR |
| (1) S1A-001 #1-3 | 45 | 38 | 0.8444 |
Table 1. Tokens, types and TTRs for sample (1).
For a TTR of words without capitalisation distinctions, ‘may’ (modal auxiliary) and ‘May’ (proper noun) would likely be treated as being of the same type. Of course this observed score is due to very many processes happening all at the same time, leading to the series of utterances we finally observe.
A key aspect is that the set of types is open. So we might define a TTR for verbs, because verbs can be considered as constituting an open set, bordered by innovation. However a TTR for auxiliary verbs is likely to be unviable, because auxiliaries are a closed-class word class. Once all auxiliary verbs have been seen in a text, the ratio can only fall as more tokens are added.
Consider the following example plot. Often, type-token ratios are plotted as in Figure 1. Working from the start of a text forwards, each repeated word (or noun, or verb) causes the ratio to fall. See Richards (1987) for similar examples.

However, this graph has an obvious drawback. It is simply a description of a particular sequence of words, rather than a property of the whole text. Were we to start our evaluation at a different point and run forward from there we would trace a different line.
A better method to assess the entire text involves computing a TTR for a running length for different segments of a fixed length, then averaging these scores. This obtains a smoother curve, as in Figure 2, and avoids the risk of bias due to possibly unusual vocabulary within a specific part.

2. Are TTRs Binomial?
A TTR is a proportion, but is it a Binomial one?
I will argue that it can be treated as a certain kind of Binomial proportion, but of a special type. It suffers from a well-known limitation, amply illustrated by these figures.
Brian Richards (1987) points out that it is very difficult to meaningfully compare samples with different numbers of tokens (n), because the larger the sample size, the smaller the TTR will tend to be.
It is hardly surprising that this should be so when samples are small, but it can also be predicted that TTRs calculated from a large number of tokens will generally be lower than those calculated from a smaller number. This is because, while obtaining more words also means obtaining more different words, each additional different word sampled is a move towards exhausting the subject’s repertoire of commonly used vocabulary Richards (1987: 203).
Figures 1 and 2 were computed for a TTR of lexical productivity. Types f represent the number of different words in the text (unique spellings), and n is the total number of words.
Definition. In this case, ‘word’ is identified as a non-‘ignored’ (corrected) ICE-GB lexical word rendered in lower case. Hyphenated words count as a single word, but compounds do not, and genitive markers are treated as separate words. I have used ICECUP indexing to identify tokens, so unique spellings and accents are distinguished.
This definition of ‘word’ however, is marginal to the results.
Each line in the graph in Figure 2 (of which there are 90) represents a single ICE-GB ‘text’ transcript of a conversational recording, so the distribution vertically illustrates the scatter of observed mean TTRs within ICE-GB conversations. We compute TTRs for subsamples from each nominal 2,000 word text of varying lengths, from 100 to 1,500-word continuous stretches.
As we commented, to avoid being biased by potential variation of productivity, topic shifts etc., within the text, we draw 10 samples from different start points in the text, and report the mean. This is not ideal, as it tends to oversample the middle section of the text as n increases, but it will do for the purposes of this discussion.
Figure 2 illustrates that the TTR declines for increasing tokens n, consistent with Richards’s observation. As an algorithm for identifying a novel token passes through a text, the chance of the next word being a new type inexorably declines.
A similar principle applies to hapax-token ratios, which we will discuss below. In such a ratio we count types that appear only once in the sample.
The relationship with sample size is approximately linear on a logarithmic scale (Blalock 1979), but with a constant.
3. Averaging TTRs
Before we proceed, another point should be briefly considered. Standardisation and averaging should be applied equally to multi-text samples.
Example. Consider pooling sample (1) with sample (2) below. They are both drawn from the beginning of two comparable ICE-GB texts, S1A-001 and S1A-002.
(2)Can you tell me how did you both get involved in the Mike Heafy project <,,>
Shall I go first
Yes
Well I got involved through Celeste who <,> I used to dance with with London Contemporary <,> going back <,> twenty years or so <,> [S1A-002 #1-4]
Treated independently, these texts obtain the descriptive statistics in Table 2.
| words | tokens | types | TTR |
| (1) S1A-001 #1-3 | 45 | 38 | 0.8444 |
| (2) S1A-002 #1-4 | 41 | 36 | 0.8780 |
Table 2. Tokens, types and TTRs for samples (1) and (2).
Now, consider how we might average them. With a conventional Binomial variable we have two options. The most common approach is a weighted mean, i.e. the ratio of the sum of frequencies for both texts, i.e. pˆ = (f1 + f2) / (n1 + n2). This is sometimes referred to as the pooled probability estimate.
The unweighted arithmetic mean, (p1 + p2) / 2, is less commonly used, because it does not take account of variable subsample size.
However, we cannot use a method of pooling and averaging with TTRs and expect to obtain a similar result. If we join the texts to compute a TTR, i.e. add the text in sample (2) to the end of sample (1), every type in (2) that also appears in (1) will be subtracted.
The resulting TTR will be less than the unweighted mean, and can fall below both of the individual TTRs for (1) and (2). It will be not an average, but the TTR of the newly-joined text. See Table 3.
| words | tokens | types | TTR |
| (1)+(2) pooled mean probability | 86 | 74 | 0.8605 |
| (1)+(2) adjoined mean (minus duplicates) | 86 | 68 | 0.7907 |
Table 3. Simply adding text (2) to (1) and computing an aggregate TTR requires us to remove duplicate types, causing the score to fall.
The best averaging method is to first standardise and then average the two texts. Now we obtain something like Table 4. First, we cut off sample (1) after word 41, so it has the same length as the shorter text, (2). Second, we take the mean of the two independent TTR observations.
| words | tokens | types | TTR |
| (1′) standardised | 41 | 35.0 | 0.8537 |
| (2) | 41 | 36.0 | 0.8780 |
| (1′)+(2) mean of standardised | 41 | 35.5 | 0.8659 |
Table 4. Mean for standardised TTRs (1′) and (2).
The average of two TTRs is not the same as the TTR computed from the two texts joined together. Indeed the average of independent TTRs will be greater than the TTR of the combined texts.
Therefore if we wish to obtain a 1,000-word TTR for, say, ‘spoken English texts in ICE-GB’, then we should take the arithmetic mean of all 1000-word standardised TTRs taken from all texts in the subcorpus ‘ICE-GB spoken’.
In Figure 1 we plotted standardised TTRs drawn from individual texts. We averaged standardised subsamples within each text to try to obtain a reliable mean (average) rate that was not biased by topic changes, etc., within the text.
We apply this average-of-averages method to corpus subdivisions comprising of multiple texts.
4. Plotting confidence intervals and testing for significant difference
We can calculate and plot a Binomial confidence interval, such as the Wilson score interval, on a TTR. But there is an issue.
- For Binomial variables, an expected frequency F is simply P × n, where P represents the population proportion (where ‘population’ is ‘all texts sampled in the same way’).
- In other words, P is independent of sample size n. With a Binomial variable, Figure 2 would be comprised of horizontal lines.
- But we know that TTRs do not have this property. For a given text, group of texts or corpus, the proportion P will tend to decrease as the sample size n increases.
What does this mean in practice? It means we can plot confidence intervals on a TTR, but care must be taken in comparing TTRs of different sample sizes. This is not a statistical problem per se – changing the confidence interval formula will not fix the issue – but a known mathematical problem that arises from the act of comparison. This is why it also affects something as simple as averages.
Given that these rates reflect a pooled set of multiple independent decisions that are not truly free to vary, it is also advisable to apply a random-text sampling adjustment (Wallis 2021: 277) for averaged TTRs. See also Section 8 below. However, it is legitimate to employ a Wilson score interval without adjustments. As we shall see, this method is conservative.
4.1 Comparing TTRs from different sample sizes
Let us now turn to the problem of comparing two TTRs, say p1 and p2, sampled from different sample sizes n1 and n2. Conventionally, we would compare proportions with a 2 × 2 χ2 test, a Newcombe-Wilson test, or by plotting a difference interval. But now we must take this TTR-sample size problem into account.
The best, and simplest, option is to standardise the TTRs by first requiring that sample sizes are identical. If n1 = n2, we can use standard methods.
But what if they are different, e.g. because you want to compare an observed TTR with one reported in a paper? We might not be able to standardise one of the TTRs. Can we predict the result of a standardised comparison?
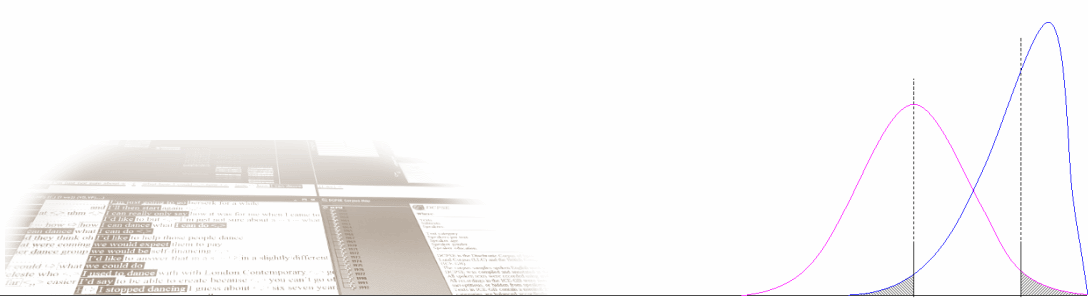
Suppose p1 is the higher score, i.e. p1 > p2, and we wish to test if the first TTR is greater than the second. Let’s consider the two possible scenarios: (A), where the higher score is based on a larger sample size, and (B), where it is based on a smaller sample.
We will assume that in performing standardisation (reducing sample sizes) the specific set of texts do not change. No texts are added or removed. We can therefore assume that decreasing n causes p to increase. Figure 4 below shows what can happen otherwise.
4.2 Scenario (A) Larger: n1 > n2
Were we to standardise the larger first sample by curtailing it to only n2 = 800 words, we can be sure P1 (and thus p1) will increase. In Figure 3 we label this increased predicted score p1′. Our observed p1 is therefore a low estimate of the predicted score.
Since p1 is already greater than p2, we can compare the non-standardised scores. If we observe a significant difference we can confidently predict that the standardised comparison would also be significant.
This evaluation is conservative, i.e. it is a weaker test than the ideal, but it allows us to draw a significant conclusion.
But we are erring on the side of caution, so this is OK.

4.3 Scenario (B) Smaller: n1 < n2
What happens if n1 < n2? Our observed p2* is now an underestimate of the standardised score we would expect if we cut off sample 2 at n1 tokens. See Figure 3. Since we are testing if p1 is significantly greater than p2, we risk Type I errors. In this scenario comparing unstandardised TTRs is insufficiently conservative, and cannot be relied on for a significant result.
If the smaller rate (p2* in Figure 3) were standardised to n1 tokens, the TTR would be expected to increase, let’s say to p2*′. The difference between the observations would be expected to reduce, and therefore a significant difference between unstandardised ratios would be unreliable. See Figure 3, left.
In summary, a significant difference between unstandardised TTRs in this scenario cannot justify a claim of a significant difference between standardised ones. The only robust method is to standardise before testing.
It might be thought that failure to observe a significant difference with non-standarised TTRs would predict a non-significant outcome for standardised scores. But it is also possible (if unlikely) that the two TTR lines could cross, p1 become less than p2, and the difference between them become significant as a result.
See the kind of ‘converging’ scenario observed at the left of Figure 2.
4.4 Should we compute intervals with the standardised sample size?
Let us return to the first, ‘larger’ case where n1 > n2. In Figure 3, the lower bound of p1 (right) is greater than the upper bound of p2, so we can see that the difference is statistically significant without even carrying out a Newcombe-Wilson test.
This uses the full sample size for p1 (n1 = 1,000) for this datapoint, not the smaller, n2 = 800, which would apply after standardisation. Our observed p1 is in fact based on this larger sample size.
This raises a question. Should we insert the smaller, standardised sample size n2 into the Wilson score interval formula, i.e. treat it as being notionally based on less data, since we are predicting whether standardised scores differ?
No. The conservative prediction, based on our data, is that P1 = w1–, where the lower bound, w1–, is calculated with n1 = 1,000. But we also predict that if n1 is standardised, P1 will be greater than this.
So in this situation we should not change the sample size. The lower bound, being a model of a conservative estimate of the true value P1, should obey the same logarithmic tendency of all TTRs, cause the observed scores to be more distinguishable, and therefore yield a significant result when standardised.
5. Can we conservatively predict standardised TTRs?
What happens if sample sizes are similar, but happen to fall on the ‘wrong’ side of the equation?
Suppose n1 is slightly smaller than n2, so we should not be permitted to conclude a significant difference, but nonetheless the observed TTRs are substantially different.
Consider the data in Table 5, drawn from Figure 3. As the sample size increases, the gradient shrinks.
| n | p | w– | w+ | |
| S1A-070 | 1,400 | 0.3186 | 0.2947 | 0.3435 |
| S1A-034 | 1,500 | 0.2279 | 0.2074 | 0.2498 |
Table 5. A slightly smaller sample with a higher TTR. At this point the logarithmic gradient is nearly flat.
The intervals do not overlap – indeed there is a gap of 5 percentage points between the two observations. Surely we should be able to conclude that their difference is statistically significant?
Likewise a simple (rms) log fit for each of these curves obtains
S1A-070 p = -0.1411 ln(n) + 1.3343
S1A-034 p = -0.1330 ln(n) + 1.1903
The problem in practice is that we need more information to predict the standardised TTR for S1A-034 (n = 1,400). We can also observe the gradient, -0.0072/100, but that is because we have exhaustively carried out the computation and we know what the standardised TTR is! We can’t take this for granted.
One might be able to generate tables from corpora for some standard TTRs (e.g. all words, all proper nouns, etc), but as an empiricist, my advice would be simply to standardise the data!
We will see another reason for this recommendation in Figure 5 below. If some texts have fewer than n tokens, they are removed from the average, disrupting the logarithmic curve. A logarithmic prediction assumes that the set of sampled texts does not change.
6. Observed TTRs for speech and writing in ICE-GB
A similar distribution of scores to those observed in Figure 1 may also be found for ICE-GB text categories. Having obtained TTRs for each text in ICE-GB using the method outlined above (the mean of TTRs drawn from equidistant samples), we may compute the mean TTR for each text category by taking the mean of these means.
Figure 4 illustrates the scatter of spoken data text categories. The most lexically varied (the TTR is for all words) are the scripted broadcast categories, and the least varied are conversations, including telephone calls, legal cross-examinations and legal presentations.

Although telephone calls are comprised of multiple sub-texts (10 texts composed of 18 subtexts), they tend to have a smaller TTR for words. This seems to be due to a higher proportion of formulaic expressions, turn taking, etc.
A TTR for nouns (see below) finds telephone calls in the middle of the TTR ranking, but with fewer tokens overall.
On the other hand the legal transcripts (with 12 or 13 subtexts per 10 texts) consistently have fewer different nouns, which we can see below. This may indicate a higher level of internal-text consistency, remaining on-topic, etc.
Figure 5 plots the mean of average resampled TTRs for nouns from 20 to 300 tokens. The upper figure exceeds the number of nouns in some texts. The fluctuations observed are primarily an artifact of the method. A text is removed from the average if it has fewer than n noun tokens.

The most varied use of nouns is found in broadcast talks, followed by broadcast news and other speeches, with the least varied being legal cross examinations, and, in order of increasing TTR: classroom lessons and legal presentations.
Finally, by way of comparison with speech data, we can plot TTRs for writing. This shows a more centrally concentrated scatter than for speech, with press news reports and editorials at the upper extreme and administrative/regulatory texts with a smaller TTR.

7. Hapax-token ratios
The observation of a systemic decline with increasing sample size n also applies to hapax-token ratios. For our purposes, we will simply refer to a ‘hapax’ as being a unique instance of a type (a word) in a sample. In practice, hapax legomena are usually only cited when drawn from very large corpora, i.e. where n is larger than the sizes we are quoting here.
Nonetheless sometimes we may see hapax-token ratios considered. As they have some similar properties to type-token ratios we will discuss them briefly.
Figure 7 plots hapax-token ratios and type-token ratios for all words, for two texts drawn from the face-to-face conversation subcorpus in ICE-GB (we selected these two because they are relative outliers). We count the same types in the exact same way, but report the hapaxes, i.e. those types which have just one token in the sample.

We can see that the proportion of hapaxes in a sample is smaller than the proportion of types, which is what we would expect. It also obeys the principle of a secular decline with increasing sample size. This means that the principles discussed in Section 4 above also apply.
However hapax-token ratios for small n tend to have a poorer fit to a logarithmic curve than do comparable type-token ratios. The most plausible explanation is that in smaller samples we are likely to have a larger proportion of what we might term ‘pseudo-hapaxes’, words that appear once in the sample but are in common use. In the smallest samples this will even include so-called ‘grammatical words’, members of closed sets and so on. Such words are rapidly eliminated in larger samples.
8. Score intervals for TTRs adjusted for random-text sampling
We will briefly discuss adjusting confidence intervals for TTRs by applying an adjustment to account for the fact that mean TTRs are drawn from texts and are not randomly-sampled Binomial variables.
Since each mean TTR per text is drawn from a subsample of equal (standardised) size, the simplified method outlined in Wallis (2021: 277) may be employed. We compute Fss = Sss2 / sss2 for the ratio between predicted and observed subsample variances:
predicted variance Sss2 = p(1 – p) / t′, and(1)
observed variance sss2 = ∑(pi – p)2 / (t′ – 1),(2)
where p is the mean observed proportion (= p for equal-sized samples), and pi is the observed proportion for sample i out of t′ non-empty samples each of size n. We then rescale the non-independent part of the total sample n:
adjusted size n′ = (n – t′) × Fss + t′.(3)
This random-text sampling method compares the variance predicted by assuming that each observed subsample TTR is free to vary about the mean of those scores (Equation (1)), with the variance actually observed (Equation (2)). If the ratio Fss is less than 1, the Binomial model is too conservative and the interval will widen. If it is greater than 1, the interval will narrow.
In Figure 8 we can see what happens with two ICE-GB spoken outlier text types, broadcast interviews and telephone calls. Both resulting intervals are considerably narrower than the unadjusted intervals (Fss is around 40-60 for telephone calls and between 8 and 13 for broadcast interviews).
A narrower interval means an increased confidence in the true rate, so this method gains predictive power.

It turns out that in these cases the variance predicted by the Binomial model is substantially in excess of that observed. This is not surprising for two reasons. TTRs are not free to vary from 0 to 1 like an ordinary Binomial variable. (Indeed their lowest possible value is 1/n, not zero.) Furthermore, our observed mean TTRs were not single observations based on n tokens, but scores averaged from 10 samples drawn along the length of each text.
In Wallis (2021: 286-287) we explored the rate of clauses that are interrogative, p(inter), and we computed adjusted intervals for superordinate and subordinate text categories in ICE-GB.
For superordinate categories like ‘spoken’ and ‘written’, data is quite heterogenous, and we observe a large scatter. This pools unlike data. This negatively affects our ability to estimate uncertainty due to sampling. As a result, in these superordinate text categories, the adjustment tends to increase the predicted variance and widen confidence intervals.
On the other hand, for individual text genres, observed variation is found to be more predictable than random sampling would imply. Applying the adjustment leads to narrower intervals and more confident predictions. We should not therefore be surprised that the interval for the ratio has narrowed.
Conclusions
With some care, it is possible to employ Binomial statistics with mean type-token ratios (TTRs) and hapax-token ratios (HTRs). The principles outlined for TTRs below also apply to hapax-token ratios.
In educational linguistics research, TTRs are frequently used as a simple measure drawn from a single text, in which case they are properly understood as observed facts about that text. TTR curves plotted word-by-word are ‘jagged’ (see Figure 1), and are not averaged. A change in topic in an essay or conversation might lead to an injection of distinct vocabulary, and a temporary TTR rise.
Such TTRs are descriptive statistics, like any observed rate from a single text. Comparing these scores is not really in the realm of inductive statistics, because we make no claim about the degree to which the sample (the single contiguous text) is representative of anything.
However, in corpus linguistics, TTRs have been used for comparing text categories or varieties of English, and – provided the sample of texts is randomly obtained – may be subject to evaluations for significant difference. When the measure is used, as far as possible we should quote averages of standardised TTRs, i.e. where the same sample size n is used for each case. Otherwise a comparison is potentially misleading.
A comparison between TTRs or HTRs based on different token frequencies n (sample sizes or text lengths) is difficult, due to a tendency for these measures to fall with increasing n. Even the simple averaging of TTRs requires careful consideration.
I would therefore recommend
- Averaging standardised TTRs/HTRs where possible to obtain an aggregate measure.
- Computing Wilson score intervals on standardised scores.
- Applying a random-text adjustment when averaging over multiple texts.
- Comparing standardised scores if at all possible.
Given our emphasis on the importance of standardisation, for advance data comparability, it would be wise for corpus linguistics researchers to adopt a convention for citing TTRs or HTRs at certain ‘standard’ data sizes, e.g. 500, 1000, 2000 words; or 50, 100, 200 nouns (etc). These should be stated alongside conventionalised definitions of words and nouns.
However sometimes data is not standardised. In this blog post, we discussed the interpretation of a significance test applied to comparing unstandardised TTRs (where n1 ≠ n2).
One source of this problem might be software. A corpus interface may simply reports the total number of hapaxes in a subcorpus, rather than counting hapaxes in the first n words. Or we may wish to compare our observed TTR with a rate reported in another researcher’s paper.
- If the larger TTR/HTR score is supported by a bigger data set than the smaller, a conventional χ² or pairwise test can be used. In essence, we are drawing a conclusion about the likely value of a standardised TTR/HTR sampled from the same sources. Our test will be conservative, because we know that were we to standardise the scores they will tend to diverge.
- However, if the larger TTR/HTR is supported by a smaller data set, the standardised scores will tend to converge, and we cannot draw such a conclusion, even if it appears tempting.
With very large n, say n > 50,000, the gradient will be almost zero. In such a case we might accept that a small difference between n1 and n2 does not require standardisation.
However, unless we have empirical evidence of the gradient, this is not a principled approach. Although the term ‘indicative results’ is routinely misused in statistics(!), we might argue that a large difference in such a case was indicative, motivating a more robust evaluation by obtaining a standardised score for the larger sample.
References
Blalock, H.M. 1979. Social statistics. Second edition. London: McGraw Hill.
Richards, B. 1987. Type/Token Rations: what do they really tell us? Journal of Child Language 14, 201-209.
Wallis, S.A. 2021. Statistics in Corpus Linguistics Research. New York: Routledge. » Announcement
