Abstract Paper (PDF)
This paper describes a series of statistical meta-tests for comparing independent contingency tables for different types of significant difference. Recognising when an experiment obtains a significantly different result and when it does not is an issue frequently overlooked in research publication. Papers are frequently published citing ‘p values’ or test scores suggesting a ‘stronger effect’ substituting for sound statistical reasoning. This paper sets out a series of tests which together illustrate the correct approach to this question.
These meta-tests permit us to evaluate whether experiments have failed to replicate on new data; whether a particular data source or subcorpus obtains a significantly different result than another; or whether changing experimental parameters obtains a stronger effect.
The meta-tests are derived mathematically from the χ² test and the Wilson score interval, and consist of pairwise ‘point’ tests, ‘homogeneity’ tests and ‘goodness of fit’ tests. Meta-tests for comparing tests with one degree of freedom (e.g. ‘2 × 1’ and ‘2 × 2’ tests) are generalised to those of arbitrary size). Finally, we compare our approach with a competing approach offered by Zar (1999), which, while straightforward to calculate, turns out to be both less powerful and less robust.
Introduction
Researchers often wish to compare the results of their experiments with those of others.
Alternatively they may wish to compare permutations of an experiment to see if a modification in the experimental design obtains a significantly different result. By doing so they would be able to investigate the empirical question of the effect of modifying an experimental design on reported results, as distinct from a deductive argument concerning the optimum design.
One of the reasons for carrying out such a test concerns the question of replication. Significance tests and confidence intervals rely on an a priori Binomial model predicting the likely distribution of future runs of the same experiment. However, there is a growing concern that allegedly significant results published in eminent psychology journals have failed to replicate (see, e.g. Gelman and Loken 2013). The reasons may be due to variation of the sample, or problems with the experimental design (such as unstated assumptions or baseline conditions that vary over experimental runs). The methods described here permit us to define a ‘failure to replicate’ as occurring when subsequent repetitions of the same experiment obtain statistically separable results on more occasions than predicted by the error level, ‘α’, used for the test.
Consider Table 1, taken from Aarts, Close and Wallis (2013). The two tables summarise a pair of 2 × 2 contingency tests for two different sets of British English corpus data for the modal alternation shall vs. will. The spoken data is drawn from the Diachronic Corpus of Present-day Spoken English, which contains matching data from the London-Lund Corpus and the British Component of the International Corpus of English (ICE-GB). The written data is drawn from the Lancaster-Oslo-Bergen (LOB) corpus and the matching Freiburg-Lancaster-Oslo-Bergen (FLOB) corpus.
Both 2 × 2 subtests are individually significant (χ² = 36.58 and 35.65 respectively). The results (see the effect size measures ϕ and percentage difference d%). appear to be different.
How might we test if the tables are significantly different from each other?
| (spoken) | shall | will | Total | χ²(shall) | χ²(will) | summary |
| LLC (1960s) | 124 | 501 | 625 | 15.28 | 2.49 | d% = -60.70% ±19.67% ϕ = 0.17 χ² = 36.58 s |
| ICE-GB (1990s) | 46 | 544 | 590 | 16.18 | 2.63 | |
| TOTAL | 170 | 1,045 | 1,215 | 31.46 | 5.12 | |
| (written) | shall+ | will+’ll | Total | χ²(shall+) | χ²(will+’ll) | summary |
| LOB (1960s) | 355 | 2,798 | 3,153 | 15.58 | 1.57 | d% = -39.23% ±12.88% ϕ = 0.08 χ² = 35.65 s |
| FLOB (1990s) | 200 | 2,723 | 2,923 | 16.81 | 1.69 | |
| TOTAL | 555 | 5,521 | 6,076 | 32.40 | 3.26 | |
Table 1: A pair of 2 × 2 tables for shall/will alternation, after Aarts et al. (2013): upper, spoken, lower: written, with other differences in the experimental design. Note that χ² values are almost identical but Cramér’s ϕ and percentage swing d% are different.
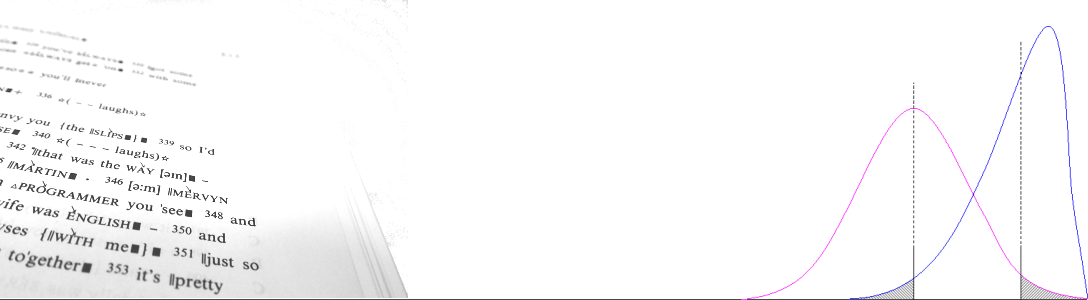
We can plot Table 1 as two independent pairs of probability observations, as in Figure 1. We calculate the proportion p = f/n in each case, and – in order to estimate the likely range of error introduced by the sampling procedure – compute Wilson score intervals at a 95% confidence level.

The intervals in Figure 1 are shown by ‘I’ shaped error bars: were the experiment to be re-run multiple times, in 95% of predicted repeated runs, observations at each point will fall within the interval. Where Wilson intervals do not overlap at all (e.g. LLC vs. LOB, marked ‘A’) we can identify the difference is significant without further testing; where they overlap such that one point is within the interval the difference is non-significant; otherwise a test must be applied.
In this paper we discuss two different analytical comparisons.
- ‘Point tests’ compare pairs of observations (‘points’) across the dependent variable (e.g. shall/will) and tables t = {1, 2}. To do this we compare the two points and their confidence intervals. We carry out a 2 × 2 χ² test for homogeneity or a Newcombe-Wilson test (Wallis 2013a) to compare each point. We can compare the initial 1960s data (LLC vs. LOB, indicated) in the same way as we might compare spoken 1960s and 1990s data (e.g. LLC vs. ICE-GB).
- ‘Gradient tests’ compare differences in ‘sizes of effect’ (e.g. a change in the ratio shall/will over time) between tables t. We might ask, is the gradient significantly steeper for the spoken data than for the written data?
Note that these tests evaluate different things and have different outcomes. If plot-lines are parallel, the gradient test will be non-significant, but the point test could still be significant at every pair of points. The two tests are complementary analytical tools.
1.1 How not to compare test results
A common, but mistaken, approach to comparing experimental results involves simply citing the output of significance tests (Goldacre 2011). Researchers frequently make claims citing t, F or χ² scores, ‘p values’ (error levels), etc, as evidence for the strength of results. However, this fundamentally misinterprets the meaning of these measures, and comparisons between them are not legitimate.
Consider the following pair of tables, T1 and T2 (Table 2).
| T1 | x | ¬x | total |
| y | 290 | 110 | 400 |
| ¬y | 220 | 200 | 420 |
| total | 510 | 310 | 820 |
| χ² = 35.27 | p ≈ 0.0000 |
| T2 | x | ¬x | total |
| y | 29 | 11 | 40 |
| ¬y | 22 | 20 | 42 |
| total | 51 | 31 | 82 |
| χ² = 3.53 | p = 0.0604 |
Table 2: Some illustrative data with the results of χ² tests for homogeneity in both cases.
A moment’s glance reveals that T1 contains exactly 10 times the data of T2, but data is distributed identically, and the gradient is the same. Computing the 2 × 2 χ² test for homogeneity (Sheskin 1997: 209), we find that T1 is significant (p is very small), whereas T2, with exactly the same distribution and gradient, is non-significant. Despite the low ‘p value’, it is also incorrect to refer to T1 as ‘highly significant’. χ², F, t and p are estimates of the reliability of results (the likelihood that results would be found on experimental replication), rather than the scale of results.
1.2 Comparing sizes of effect
‘Effect size’ statistics, such as probability difference, percentage swing, log odds, Cramér’s ϕ, Cohen’s d, etc. attempt to summarise observed distributions in terms of their absolute difference. They factor out differences due to the quantity of data observed and may legitimately be employed for comparison purposes.
Cramér’s ϕ (Sheskin 1997: 244) is based on χ², but it is scaled by the total quantity of data in the table, N. For a 2 × 2 table with cell frequencies represented as [[a, b] [c, d]], we can compute a signed score with equation (1) ranging from [-1, 1]. With larger tables of dimensions r × c, the unsigned score (2) may be used, where k is the number of cells along the shorter side, i.e. min(r, c).
ϕ ≡ (ad – bc) / √(a+b)(c+d)(a+c)(b+d) (1)
|ϕ| ≡ √χ² / (k-1)N (2)
In the case of the tables above, both tables obtain exactly the same score, ϕ = 0.2074.
Effect size measures adjust for the volume of data and measure the pattern of change (the ‘gradient’) observed. However, effect size comparisons are discussed in the literature in surprisingly crude terms, e.g. ‘strong’, ‘medium’ and ‘weak’ effects (cf. Sheskin 1997: ibid). This is unsatisfactory.
To claim a significant difference in experimental outcomes between experimental ‘runs’, one method would be to establish that effect sizes (e.g. ‘gradients’) significantly differ. In the case of larger tables of more than one degree of freedom, we extend this principle to one in which distributions are compared in an analogous manner.
As a shorthand we will refer to a difference in distribution as ‘separability’. In this paper we attempt to address how the question of ‘significant separability’ may be evaluated.
1.3 Meta-tests
The tests we describe here represent the building blocks for ‘meta-analysis’: they provide a method for comparing experimental results.
Other researchers have proposed tests for comparing experimental runs. The McNemar test (Sheskin 1997: 315) translates two repeated sets of scores (such as one column in Table A vs. the equivalent column in Table B) to a χ² test; Cochran’s Q test (ibid: 469) generalises this to k sets of scores.
The most similar meta-test to the approach we discuss below is Zar’s chi-square heterogeneity analysis (Zar 1999: 471, 500). Section 5 reviews these tests and compares them with our approach. The key difference is that Zar’s method assumes that data in both samples have (approximately) the same prior distribution (i.e. the same starting point), whereas our tests do not.
In this paper we discuss contingency tests. A comparable procedure for comparing multiple runs of t tests (or ANOVAs) is the test for interaction in a factorial analysis of variance (Sheskin 1997: 489) where one of the factors represents the repeated run.
This paper is laid out as follows. Following some preliminaries, in section 3 we introduce the ‘point test’ and ‘multi-point test’ for comparing the distribution of data across the dependent variable in homogeneity tables. Section 4 introduces ‘gradient test’ methods for comparing sizes of effect in homogeneity tables, commencing with intervals and tests with a single degree of freedom, a test comparing Cramér’s ϕ effect sizes, and ending with formulae for generalising tests to compare larger tables (r × c homogeneity tables).
Section 5 introduces a similar range of ‘gradient’ meta-tests for comparing goodness of fit test results. In section 6 we compare our methods with Zar’s alternative approach, and section 7 is the conclusion.
Contents
- Introduction
1.1 How not to compare test results1.2 Comparing sizes of effect1.3 Meta-tests
- Some preliminaries
2.1 Test assumptions2.2 χ², z and Wilson intervals2.3 Example data and notation
- Point and multi-point tests for homogeneity tables
3.1 The Newcombe-Wilson point test3.2 The Gaussian point test3.3 The multi-point test for r × c homogeneity tests
- Gradient tests for homogeneity tables
4.1 The 2 × 2 χ² test for homogeneity4.2 The 2 × 2 Newcombe-Wilson test4.3 Cramér’s ϕ interval and test4.4 r × 2 homogeneity tests4.5 r × c homogeneity tests4.6 Interpreting meta-tests for large tables
- Gradient tests for goodness of fit tables
5.1 The 2 × 1 χ² goodness of fit test5.2 The 2 × 1 Wilson interval test5.3 r × 1 goodness of fit tests
- Hetereogeneity χ² tests
- Conclusions
- Acknowledgments
Citation
Wallis, S.A. 2019. Comparing χ² Tables for Separability of Distribution and Effect: Meta-Tests for Comparing Homogeneity and Goodness of Fit Contingency Test Outcomes. Journal of Quantitative Linguistics 26:4, 330-355. » Pre-published version
Citation (book version, including subset tests)
Wallis, S.A. 2021. Meta-Tests for Comparing Tables of Results. Chapter 15 in Wallis, S.A. Statistics in Corpus Linguistics Research. New York: Routledge. 233-260.
References
Aarts, B., Close, J, and Wallis, S.A. 2013. Choices over time: methodological issues in investigating current change. » ePublished. Chapter 2 in Aarts, B., Close, J, Leech, G. and Wallis, S.A. (eds.) The Verb Phrase in English. Cambridge: CUP. » Table of contents and ordering info
Gelman, A. and Loken, E. 2013. The garden of forking paths. Columbia University. » ePublished
Goldacre, B. 2011. The statistical error that just keeps on coming. Guardian, 9 September 2011.
Sheskin, D.J. 1997. Handbook of Parametric and Nonparametric Statistical Procedures. 1st Edition. Boca Raton, Fl: CRC Press.
Wallis, S.A. 2013a. Binomial confidence intervals and contingency tests: mathematical fundamentals and the evaluation of alternative methods. Journal of Quantitative Linguistics 20:3, 178-208. » post
Wallis, S.A. 2013b. z-squared: the origin and application of χ². Journal of Quantitative Linguistics 20:4, 350-378. » Post
Zar, J. H. 1999. Biostatistical analysis. 4th Edition. Upper Saddle River, NJ: Prentice Hall.
